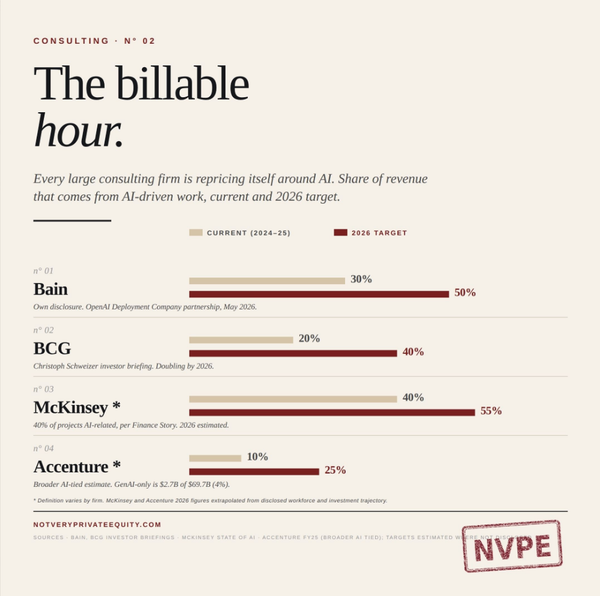
The LBO model
An LBO model, short for leveraged buyout model, is the spreadsheet a private equity firm builds to decide whether to buy a company and what to pay for it. At its core, it projects a target company's future cash flows, layers on a proposed capital structure (equity from the PE fund plus debt from lenders), assumes an eventual exit price, and calculates the return the equity investor would make. The "leveraged" part refers to the debt. If a PE firm buys a company with 50% equity and 50% debt, and sells it later for 50% more than the purchase price, the return on the equity is roughly doubled because the debt stays the same in absolute terms. That is the whole trick.
That is the textbook answer. Here is what actually happens.
What an LBO model is actually doing
An LBO model is not a forecasting tool. It is a negotiating tool.
A PE firm starts with an asking price from the seller, usually expressed as a multiple of EBITDA. Say the seller wants 12x EBITDA and the company does $50m of EBITDA, so the enterprise value asked is $600m. The PE firm's job is to work out whether that price, financed with a realistic capital structure and exited in five years at a realistic multiple, produces a return that beats its required hurdle rate.
Most LBO models are built to produce a target return, usually 20-25% IRR on the equity. The associate running the model starts with the asking price and reverse-engineers the assumptions needed to hit that number. If the assumptions are plausible, the deal is worth pursuing. If the assumptions require the company to grow revenues 15% a year when it has never grown more than 6%, or require the exit multiple to expand from 12x to 14x, the deal is probably not worth the asking price.
This is why LBO modelling feels artisanal even though it follows a tight template. The numbers are a way of arguing about what to pay.
The five components that matter
Every LBO model has the same five moving parts. Everything else is detail.
One, the purchase price. Usually expressed as an EBITDA multiple. This is the number the PE firm is trying to negotiate down and the seller is trying to hold up. The model tests sensitivity across a range (say 10x to 13x).
Two, the capital structure. How much equity from the fund, how much debt from which lenders, what interest rates. Modern LBOs in 2026 are commonly 40-50% equity and 50-60% debt. The debt is usually in multiple tranches: senior secured term loan, second-lien loan, sometimes a high-yield bond or PIK mezzanine layer. Each tranche has its own rate and amortisation schedule.
Three, the operating forecast. What happens to revenue, margins, and cash flow during the hold period. This is where the value creation thesis lives. Cost takeouts, pricing actions, add-on acquisitions, margin expansion. Everything the PE firm plans to do between year one and year five shows up here. This is also where most models are most wrong, because the assumptions are usually optimistic.
Four, the exit assumptions. What multiple the company sells for in year five, and what its EBITDA looks like by then. Multiple expansion (selling at 12x when you bought at 10x) is one of the most common ways LBO models generate their paper returns. In practice, multiple expansion is not a strategy you control. You control EBITDA growth. You get lucky on multiple expansion.
Five, the returns calculation. Given all of the above, what IRR and MOIC does the equity make, and what is the sources-and-uses picture of cash at exit. Most models run this in a summary tab that lets the investment committee see the answer in a single view.
The three numbers PE firms care about more than the spreadsheet itself
If you are watching a partner review an LBO model in a meeting, they are not checking the formulas. They are looking at three numbers.
The entry multiple versus the sector median. If your comp set trades at 9x and you are paying 12x, you are paying a premium. Whether that premium is defensible depends on whether the company is genuinely better than its peers or you just fell in love with the deal.
The leverage multiple at close. Debt divided by EBITDA. This is the number that determines how much room for error the deal has. Under 6x is mainstream. Above 7x is aggressive. Above 8x is genuinely risky and requires a lot of operational improvement to even get back to market leverage.
The implied annual EBITDA growth in the plan. The model's assumed EBITDA in year five divided by today's EBITDA, annualised. If the answer is 4-6%, that is conservative and deliverable. If it is 10-12%, you are modelling aggressive growth and you need to believe the thesis. If it is 15%+, you are either buying a genuinely high-growth business or lying to yourself.
The mechanics that tutorial posts over-explain
Most of what appears in LBO tutorial content is irrelevant to understanding what actually makes a deal good or bad. It is mechanics. Here is what you actually need to know.
Sources and uses at close. The model shows where the money to buy the company comes from (equity, different debt tranches, roll-over equity from management) and where it goes (purchase of equity, refinancing of existing debt, transaction fees, etc.). This always balances. It is accounting. The sources-and-uses table is where you double-check that the deal actually closes.
Debt schedule. The model tracks each tranche of debt, its interest rate, its amortisation, and its ending balance year by year. Cash interest flows into the income statement, PIK interest compounds on the balance, amortisation pays down principal, mandatory prepayments kick in if the company generates excess cash. This is a lot of mechanics, and most of it is boilerplate.
Operating build. Revenue forecast, cost forecast, EBITDA, working capital, capex. Standard three-statement modelling with LBO-specific adjustments. Nothing in the operating build is unique to LBO modelling; it is just financial modelling.
Returns waterfall. At exit, the proceeds flow through the debt first, then to the equity. The equity return gets calculated in multiple ways: total cash return, IRR, MOIC. If there is a management incentive plan (MIP), the returns also flow through a preferred-and-common waterfall where management's equity only participates above a certain threshold.
Understanding this list makes you about 80% as useful as a PE analyst. The other 20% is knowing which numbers to push in a negotiation, which is judgement.
Where the model actually fails
Most LBO models fail because of three things, all of them assumptions, not mechanics.
The operating plan was too optimistic. The company cannot deliver the revenue growth or margin expansion the model assumed. This is the most common failure mode. It is also the hardest to spot, because every sell-side process produces a management presentation that justifies aggressive assumptions.
The exit multiple compressed. You bought at 12x and when it was time to exit, the market was only paying 9x. Either because the sector became less favoured, or because the broader market repriced. This is why 2021 vintage deals that relied on multiple expansion are struggling now.
Leverage bit harder than expected. Interest rates moved against the company, a covenant got tripped, or a recession made the EBITDA drop just as the debt load was highest. This is less about the model being wrong than about the structure having no cushion.
The closing take
The LBO model is a way of thinking, not a fortune-telling device. Its job is to force the deal team to be explicit about what has to be true for the deal to work. When the assumptions are honest, the model is a useful guide. When the assumptions are back-fit to a target return, the model is theatre dressed up as analysis.
If you want to look at an LBO model and know whether the deal is any good, you do not need to understand the Excel mechanics. You need to understand three things. What are they paying relative to what the company is worth. How much leverage are they using. And how confident can you be in the operating plan.
Everything else is decoration.
For the bigger picture of how all of this fits together, start with what is private equity. For more structural explainers, see the rest of the toolkit, including dividend recapitalisation, PIK financing, and sale-leasebacks. For how the EBITDA in any LBO gets adjusted before close, see EBITDA add-backs. For how purchase-price gaps between buyer and seller get bridged, see earn-outs. For the post-IPO tax mechanism that captures the basis step-up, see tax receivable agreements.
See also: PE fee calculator · PE glossary